


Every tech leader knows the pattern. Quarter after quarter, you add more dashboards, more metrics, more reports. Your teams are drowning in data but still making strategic decisions based on hunches. The weekly metrics review has become a 90-minute marathon that produces exactly zero actionable outcomes.
The problem compounds at scale. What worked for a 50-person organization breaks down at 500. And by the time you hit enterprise scale, you’re managing analytics sprawl across dozens of tools. Each department is running its own shadow BI operation, with no consistent data governance or master data management.
This article covers how enterprises actually get value from their analytics investments. Not the vendor promises, but the practical approaches that inform business decisions across multiple teams, geographies, and data sources.
Business Analytics: Beyond the Basics
Business analytics is a data-driven approach to solving business problems. It uses data analysis to find patterns, understand performance, and guide decisions across every department. At enterprise scale, business analytics focuses on creating decision frameworks that provide insights across complex organizations.
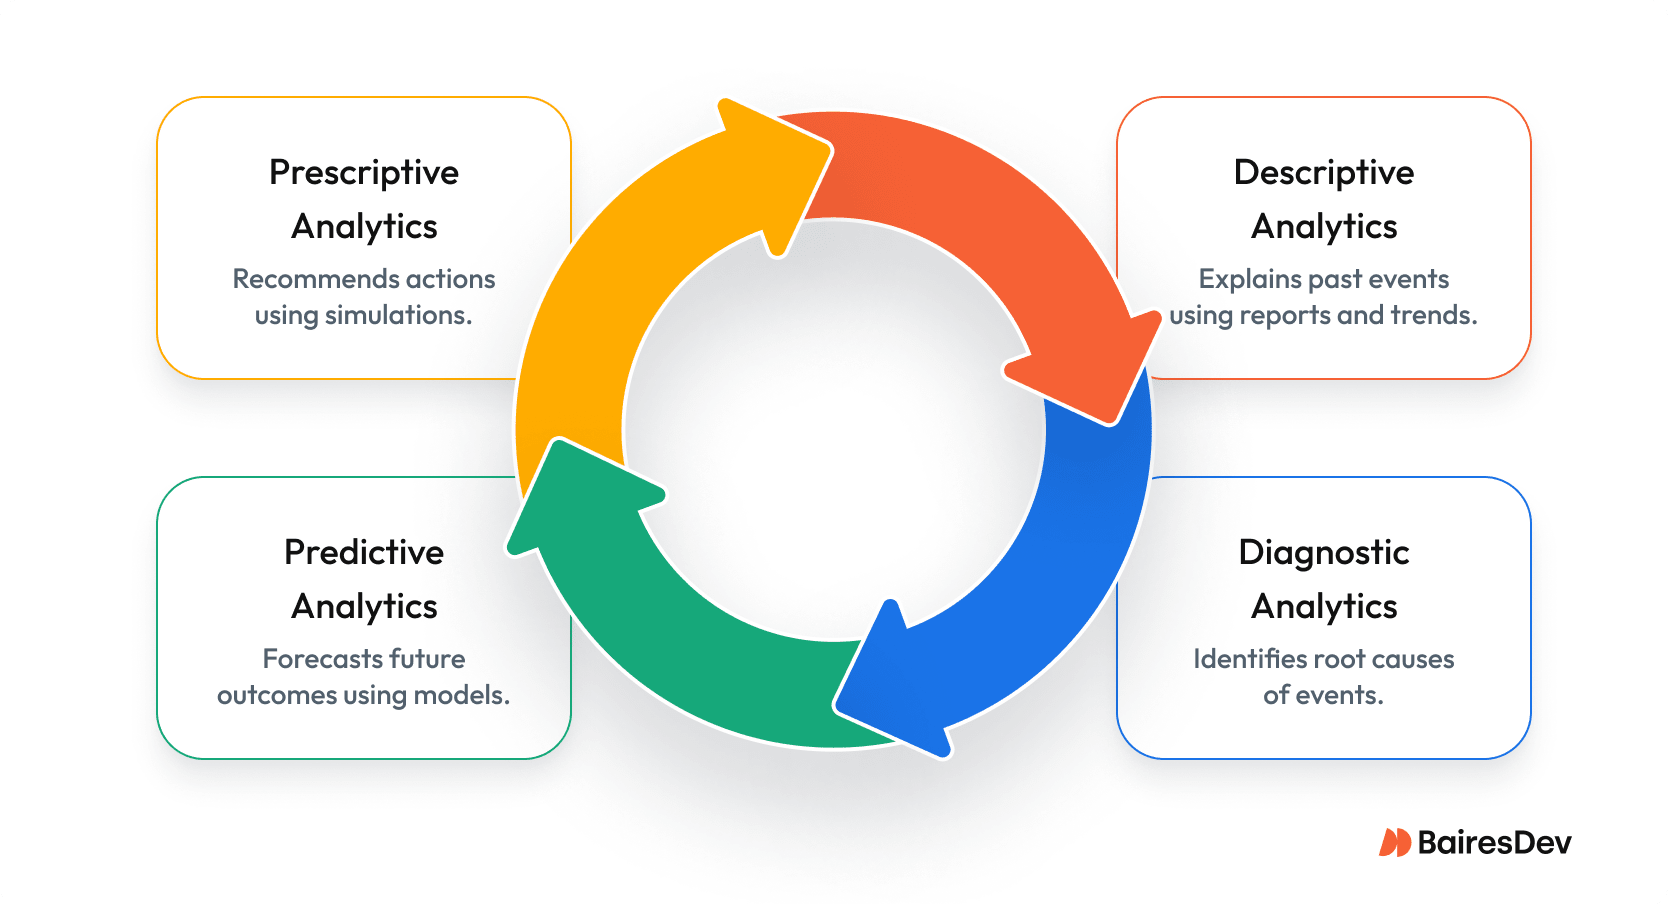
The traditional categories still apply but take on different meaning when you’re dealing with distributed teams and multiple data sources:
- Descriptive analytics explains what happened using reports and trends.
- Diagnostic analytics digs into why it happened by analyzing root causes.
- Predictive analytics forecasts what might happen next using models.
- Prescriptive analytics recommends actions using simulations and scenarios.
Modern teams use data and analytics not just to collect data, but to act on it and connect insights to outcomes. In Competing on Analytics, Thomas Davenport and Jeanne Harris point out that the context behind the numbers impacts business performance.
Analytics Capabilities: Build vs. Buy Priorities
The Harvard Business School points out that business analytics comes down to a simple formula. “Data without insights is meaningless, and insights without action are pointless.”
Not every analytics capability deserves equal investment. Here’s where enterprises typically focus their resources:
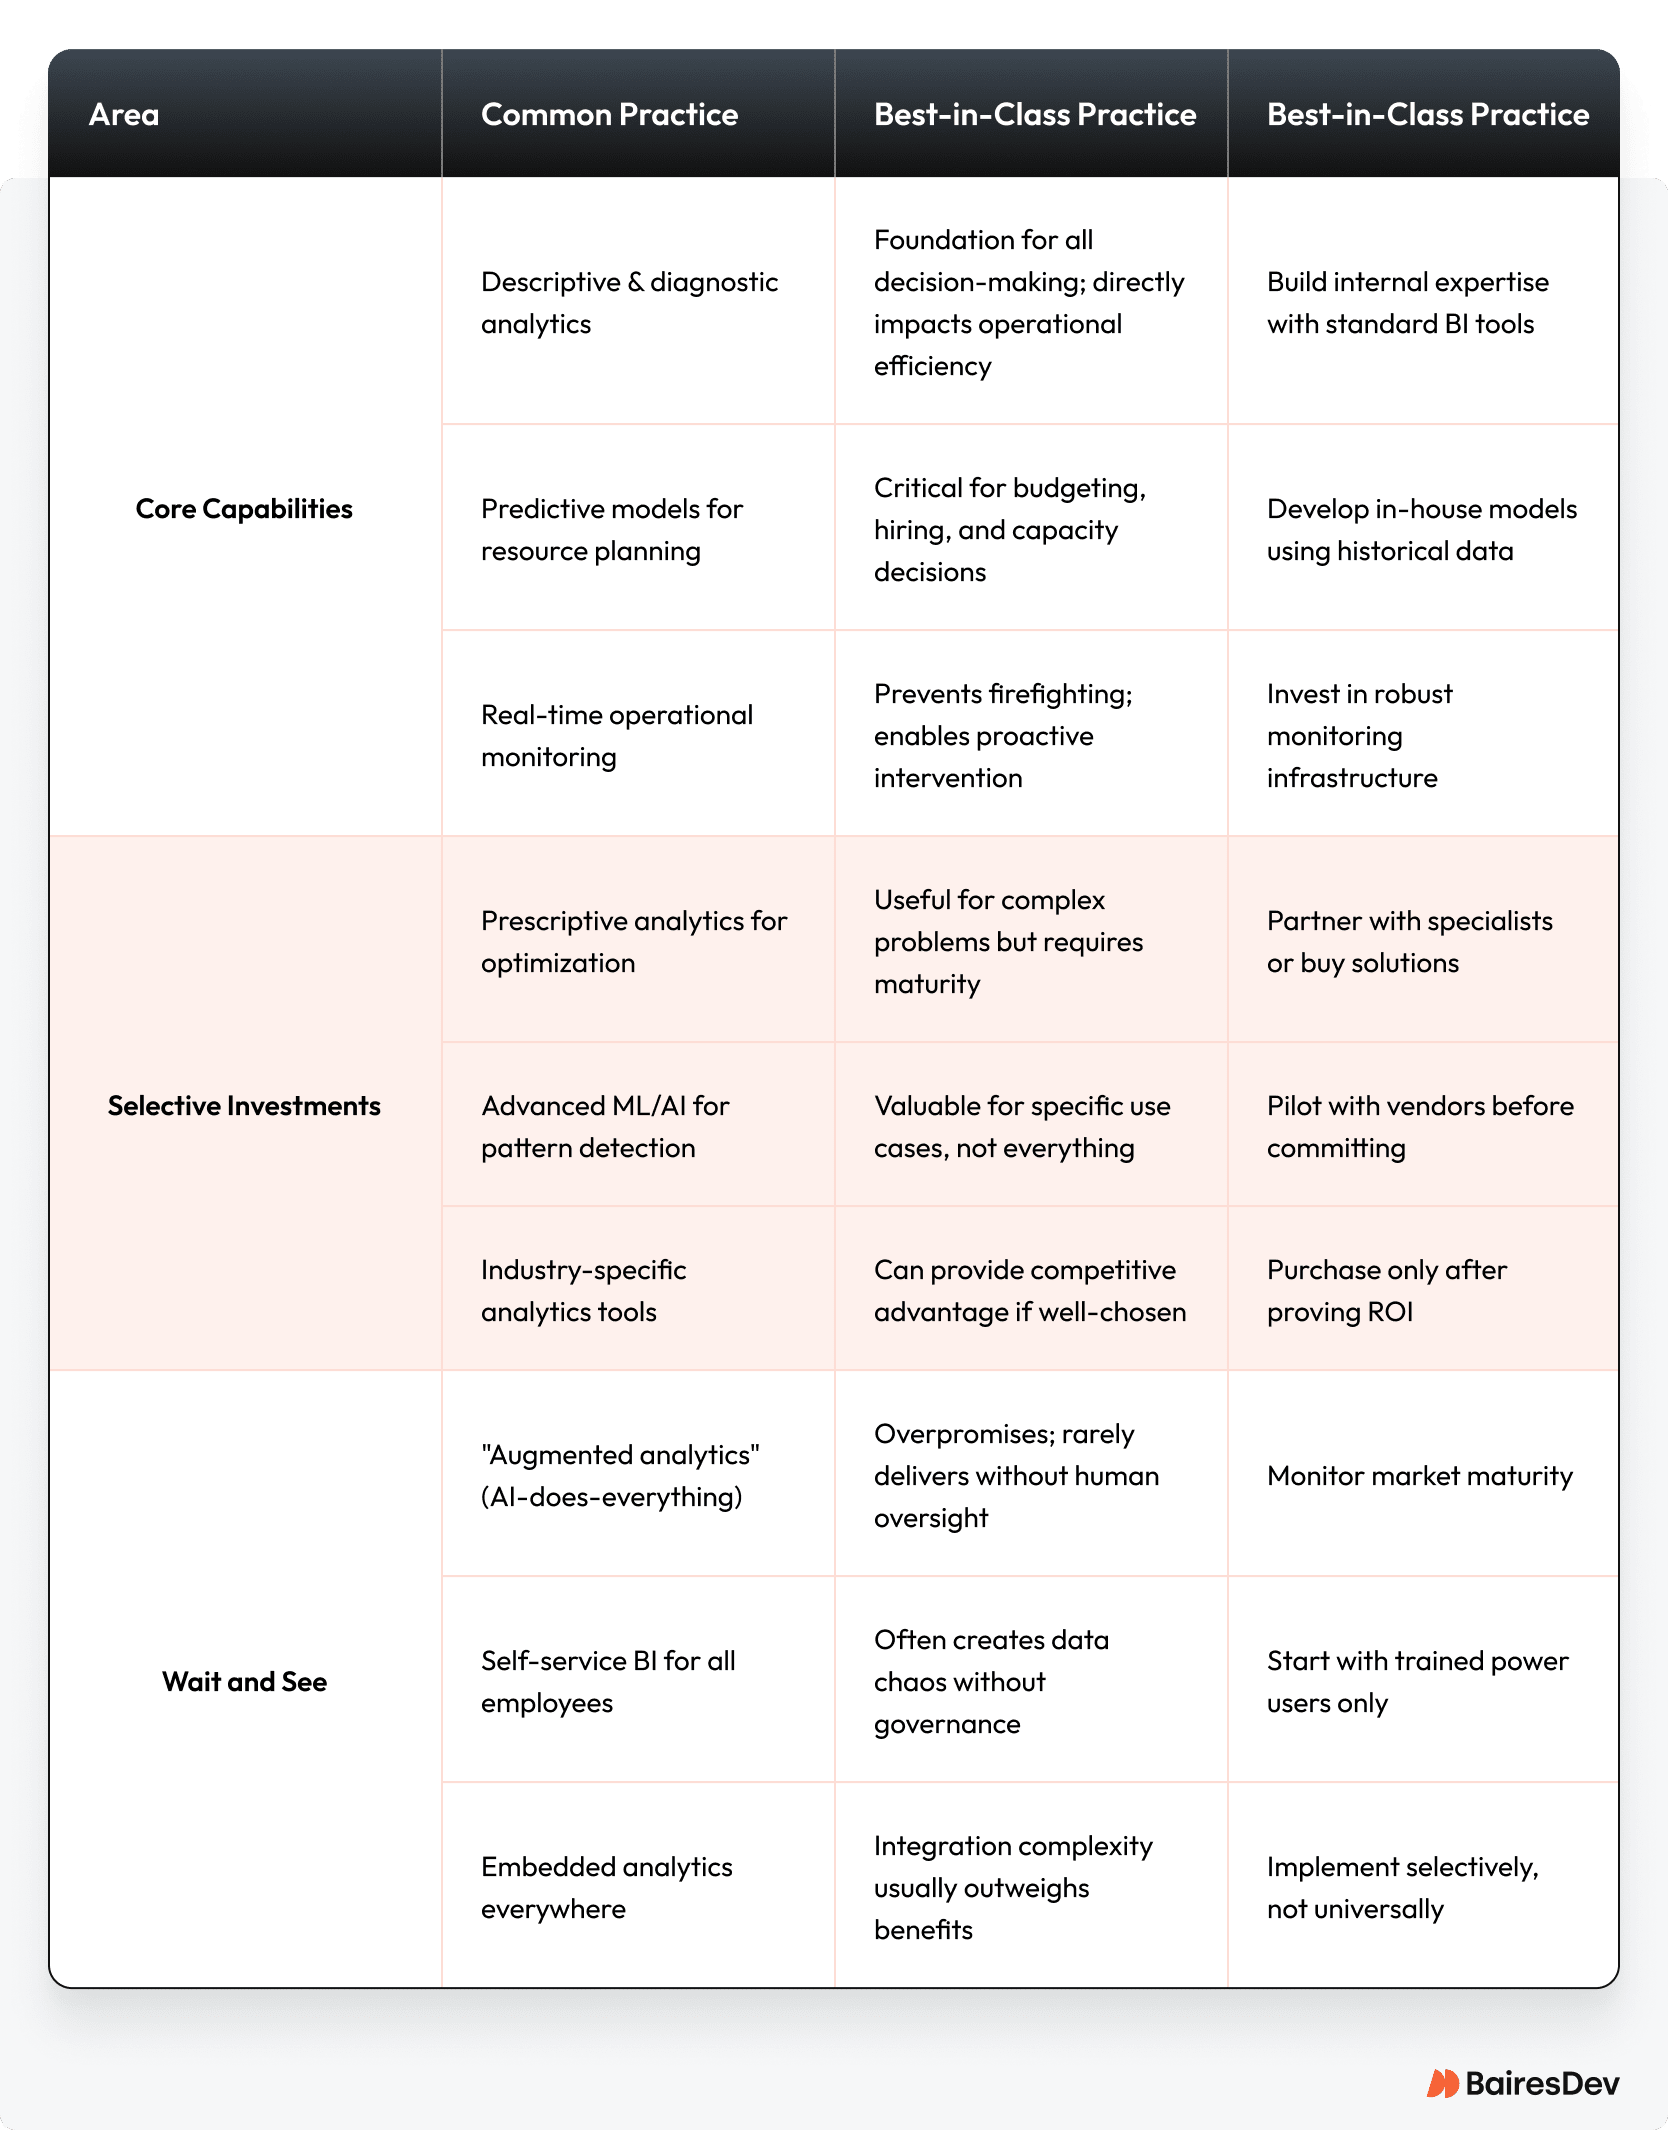
The organizations getting real ROI from analytics aren’t trying to implement everything at once. They’re building strong foundations in core capabilities while selectively investing in advanced tools that solve business problems. The key is resisting vendor hype and focusing on what actually drives better decisions at your current maturity level.
Foundation Analytics: The Starting Point
Before chasing advanced AI or predictive models, organizations need rock-solid basics—the descriptive and diagnostic capabilities that answer what’s happening and why.
Descriptive Analytics
Most enterprises have no shortage of dashboards. The problem is extracting signal from noise when you’re tracking 200+ KPIs across departments.
The value of descriptive analytics isn’t in having more data—it’s in having the right data presented in ways that drive data-driven decisions. This means ruthlessly cutting metrics that don’t inform action and focusing on data quality over quantity.
Tracking too many metrics leads to dashboard fatigue. Audit your KPIs and zero in on filters that give insights. Use the table below to decide what to keep and what to cut when working with your organization’s data.
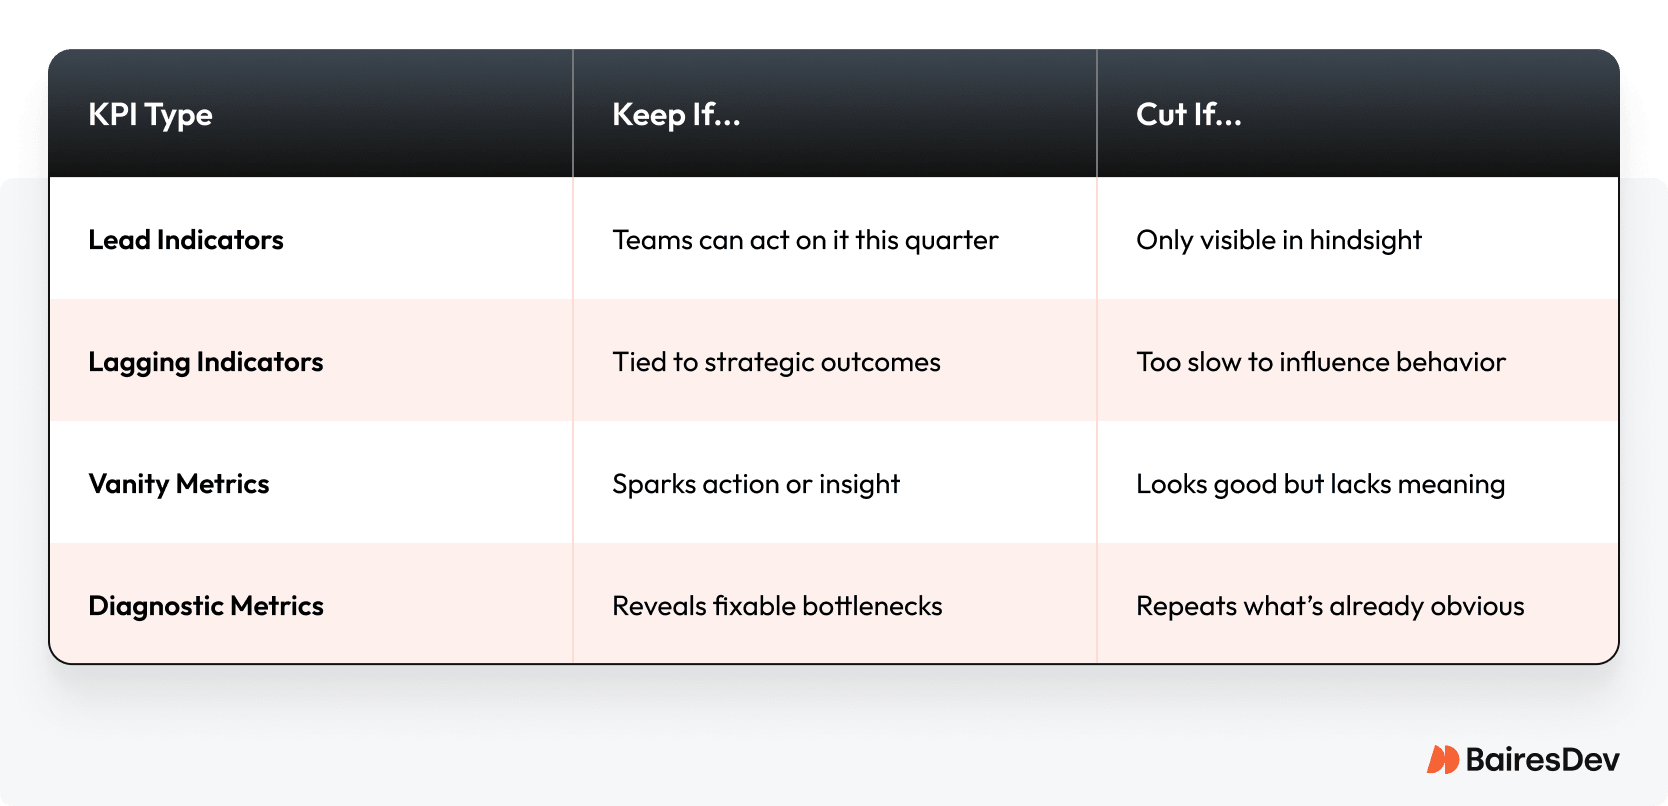
Even data wizards as good as Fei-Fei Li can fall into a reporting rabbit hole. The discipline isn’t in tracking everything possible—it’s in tracking what matters for decisions you need to make this quarter. Quantitative methods only work if they help you solve business problems, not just check boxes.
Diagnostic Analytics
Diagnostic analytics separates surface-level symptoms from root causes. While descriptive analytics tells you revenue dropped 15% last quarter, diagnostic analytics reveals why.
As far back as 1933, Alfred Korzybski said, “The map is not the territory.” Metric obsession is that urge we all get to get lost in our data. Advanced analytics can be powerful, but to analyze data in a way that moves your KPIs, ditch redundant reports. Most organizations get trapped analyzing correlation patterns that lead nowhere. The teams that succeed focus on hypothesis-driven investigation: start with a clear theory about cause and effect, then test it systematically.
Consider a SaaS company seeing increased churn. The knee-jerk response is often “improve customer support” or “add more features.” But diagnostic analysis might reveal that customers who don’t integrate within 14 days have 3x higher churn—pointing to an onboarding problem, not a product problem. This insight transforms a vague “reduce churn” mandate into a specific, measurable intervention that improves financial performance.
Real-Time Analytics: Speed vs. Signal
Real-time analytics lets teams react to market trends. In sales and ops, that speed can solve business challenges in the moment.
Most organizations get trapped analyzing correlation patterns that lead nowhere. The teams that succeed focus on hypothesis-driven investigation: start with a clear theory about cause and effect, then test it systematically.
Real-time tools help inform management decisions, but the key is building response frameworks before you need them. Use them to ask the right questions and spot gaps that predictive models may miss. Regression analysis is nice, but structured thinking solves real problems.
Competitive Advantage: Where Leaders Invest
Most enterprises get decent at reporting what happened. The winners predict what’s next and know exactly what to do about it.
Predictive Analytics: Looking Ahead
Predictive analytics is enterprise fortune-telling backed by math. You’re using historical patterns and machine learning to forecast future outcomes. Sounds simple. It’s not.
The problem is that most predictions sit unused in PowerPoints because nobody trusts them enough to bet their quarter on them. Or worse, teams treat model outputs like gospel and miss obvious context the model couldn’t see.
Smart organizations start small. Pick one expensive problem. Maybe it’s predicting which deals will slip past quarter-end. Build a simple model. Test it against reality for a few cycles. Only then expand. This builds trust gradually instead of asking executives to reshape strategy based on black-box predictions they don’t understand.
For example, take a VP of Product under pressure to hit roadmap deadlines. She might use analytics to forecast feature delivery risks. Instead of waiting for delays mid-quarter, she can simulate resource allocations and spot bottlenecks before they happen.
Prescriptive Analytics: What Should We Do?
Prescriptive analytics is where math meets guts. You’ve predicted three scenarios. Now what?
This type of business analytics goes past insights into actions. The analytics literally tell you what to do. Powerful when it works, but mistakes can be expensive.
The failure point usually isn’t technical. It’s human. The real challenge is translating outputs into something people understand. Use data storytelling to explain the “why” behind the recommendation. Tools like Qlik Sense can help, but the value lives in how you frame the outcome, especially when it comes to business fundamentals.
For example, you might run a pricing simulation that shows you could boost revenue by raising rates 5%. But unless you explain that outcome to your team, they may not act.
Emerging Capabilities: Proceed with Caution
These are the shiny objects every vendor is pushing. Some work, but many don’t. Here’s how to tell the difference.
Augmented Analytics: Let AI Do the Heavy Lifting
90% of business leaders say AI is essential, but only a few use it right.
AI-augmented analytics uses artificial intelligence and machine learning to surface insights automatically. The tools work best for specific, bounded problems.
Think of AI tools as assistants. They run statistical models and flag correlations, but they don’t know your business context. That’s where business analysts come in. They translate those automated results into insight and strategy. Tools shouldn’t replace your gut, but give it more food for thought.
When paired with curated data management and the right business analytics programs, augmented analytics boosts your team’s ability to filter signals from noise.
For example, you might use an AI-powered tool to flag a sudden drop in product usage among a segment of users. On its own, the alert is just noise. But when a business analyst connects it to a recent UX update, it becomes a meaningful insight. You can now roll back the change or run an A/B test to confirm the cause.
Self-Service Business Intelligence: Data for Everyone
Self-service business intelligence works when you have clear definitions, clean data, and trained users. Most enterprises have none of these. So marketing counts leads one way, sales counts them another, and board meetings become arguments about whose numbers are right.
Notion and Airtable can deliver meaningful business analysis even without coding. With the right equipment, any business analyst can be data driven without getting overwhelmed by tech. The true power of self-service BI is the shift in mindset. Democratizing data invites more people into the conversation.
Start small. Pick five power users. Train them properly. Let them build reports for their teams. Expand gradually.
Embedded Analytics: Insights Where You Work
Embedded analytics integrates descriptive and predictive types of analytics into the apps your team already uses. Your CRMs and ERPs will need means fewer tabs and give more business analytics value in the moment. No context switching! Except now you’re maintaining integrations across 20 tools, each with its own data model.
Pick your battles. Embed analytics where decisions happen frequently and speed matters. Your sales team checking deal health fifty times a day? Embed it. Annual planning metrics? A separate dashboard is fine.
As Hans Rosling showed through global data storytelling, clarity beats complexity. Integrated business analytics brings context directly into decision points, transforming raw data into focused direction.
The vendors won’t tell you this, but embedded analytics is only worth it when the integration pain is less than the context-switching pain. Usually that’s 2-3 critical workflows, not everything.
Enabling Technologies
The infrastructure choices you make now determine whether analytics becomes a competitive advantage or expensive shelf-ware.
Data Storytelling: Make Metrics Memorable
Numbers don’t change minds. Stories do. Yet most enterprises present data like evidence in court instead of narratives that drive action.
Data storytelling brings business analytics to life by turning metrics into narrative. Don’t show me conversion dropped 3%. Tell me we’re losing 200 customers a month to a competitor’s feature we could build in a sprint. One is data. The other makes people move.
The most effective business analysts aren’t buried in SQL. They’re storytellers who frame insights with clarity and purpose. Skip the 3D pie charts and complex data visualization. Focus on connecting data points to business objectives. Whether they’re using Tableau or just Excel, they make metrics easier to trust. The medium doesn’t matter. Clarity does.
By choosing context over clutter, your team can prioritize insight and move faster. In Daniel Kahneman’s excellent book Thinking, Fast and Slow, the author shows us that decisions stick when they hit both logic and emotion.
Cloud Analytics: Flexible and Scalable
81% of IT decision-makers say siloed data is the biggest barrier to digital transformation.
Cloud analytics platforms like BigQuery are redefining business analytics by letting teams sync vast data sets without lag. They’re perfect for real-time decision-making, especially in distributed orgs. But without KPIs, it’s easy to have too many dashboards.
Successful cloud analytics deployments treat centralization as a discipline, not a default. Yes, BigQuery can handle petabytes. That doesn’t mean you should dump everything in there. Moving to the cloud solves infrastructure problems but creates data warehousing and integrating data challenges.
The enterprises winning with cloud analytics use it for collaboration, not just storage. When your EMEA and LATAM teams can access the same real-time data as headquarters, decisions sync up.
No-Code Analytics Tools: Power Without Programming Languages
No-code business analytics tools democratize analytics. Whether that’s good depends entirely on your implementation.
Done right: Data analysts and business users answer their own questions without waiting for IT. Quick experiments. Rapid insights. Everyone moves faster.
Done wrong: Shadow IT explosion. Every department builds conflicting metrics. Nobody knows which dashboard is right. You’ve traded IT bottlenecks for data anarchy.
Business analytics get a lot more practical when the people closest to the problems are driving the insights. Let teams explore within guardrails. Think of it as guided freedom—users can build what they need but can’t redefine what “revenue” means.
Business Analytics: From Insight to Impact
Successful business analytics isn’t about tracking everything—it’s about building analytical skills that connect data insights to business objectives. Focus on the fundamentals: strong data management, clear strategic decisions, and teams who can identify trends that solve real business problems.
Whether building capabilities internally or augmenting with specialists who understand both data science and business processes, the key is bridging the gap between analysis and action.
Partner with BairesDev to move from insight to impact with professionals who deliver both technical depth and business impact.
Frequently Asked Questions
How do I prioritize which metrics to track?
Focus on KPIs that tie to business outcomes. Start by filtering out vanity metrics and identifying leading indicators you can act on now. A strong analytics strategy aligns these metrics with organizational goals.
How do we source experienced data scientists quickly?
The data scientist shortage is real—good ones have multiple offers. Instead of competing in lengthy recruiting battles, many enterprises use staff augmentation to access pre-vetted data scientists immediately. This provides expertise on-demand without the 3-6 month hiring timeline.
What’s realistic ROI for analytics investments?
Expect 6-month payback on focused initiatives (automating reports, optimizing pricing). Full analytics transformation takes 18-24 months but can deliver substantial efficiency gains across operations. Start small, prove value, then scale.
What’s the role of data storytelling in executive reporting?
Data storytelling turns big data analytics into actionable insights by adding context. It helps teams move from numbers to decisions, especially when presenting to leadership. Framing key takeaways clearly aligns your analytics strategy across departments.
How does predictive analytics support business planning?
Predictive analytics uses data mining to forecast future trends. In business planning, this enables more accurate resource allocation and scenario modeling. Leaders can make proactive decisions instead of reacting to last-minute surprises.
Can I use business analytics without coding skills?
Yes. Many big data analytics platforms now support no-code interfaces. That lets them analyze data without coding teams. Tools like Airtable let non-technical team members contribute directly to the analytics strategy.


